SAN FRANCISCO MARKET UPDATE – June 2020
June 2, 2020

June 2, 2020
 As we reported in our April and May newsletters, the fundamentals of the housing economy remain strong. In April, despite the fact that forecasters downgraded the U.S. economic outlook due to the effects of the pandemic, mortgage-finance giant Fannie Mae said that it expects the 2020 national median existing-home prices to rise from $272,000 to $275,000. Demand and supply have not moved in lock step and demand still outpaces supply. The National Association of Realtors (NAR) reported that even though buyer demand softened and nationwide sales fell 8.5% from the prior month, the supply of homes on the market decreased even faster. Even before the pandemic, the housing market was undersupplied for years. Lawrence Yun, NAR’s chief economist, emphasized the persistent supply issue when he said in April, “You would have to see continuing job losses for a prolonged period leading to foreclosures, and even then we may not have oversupply.”
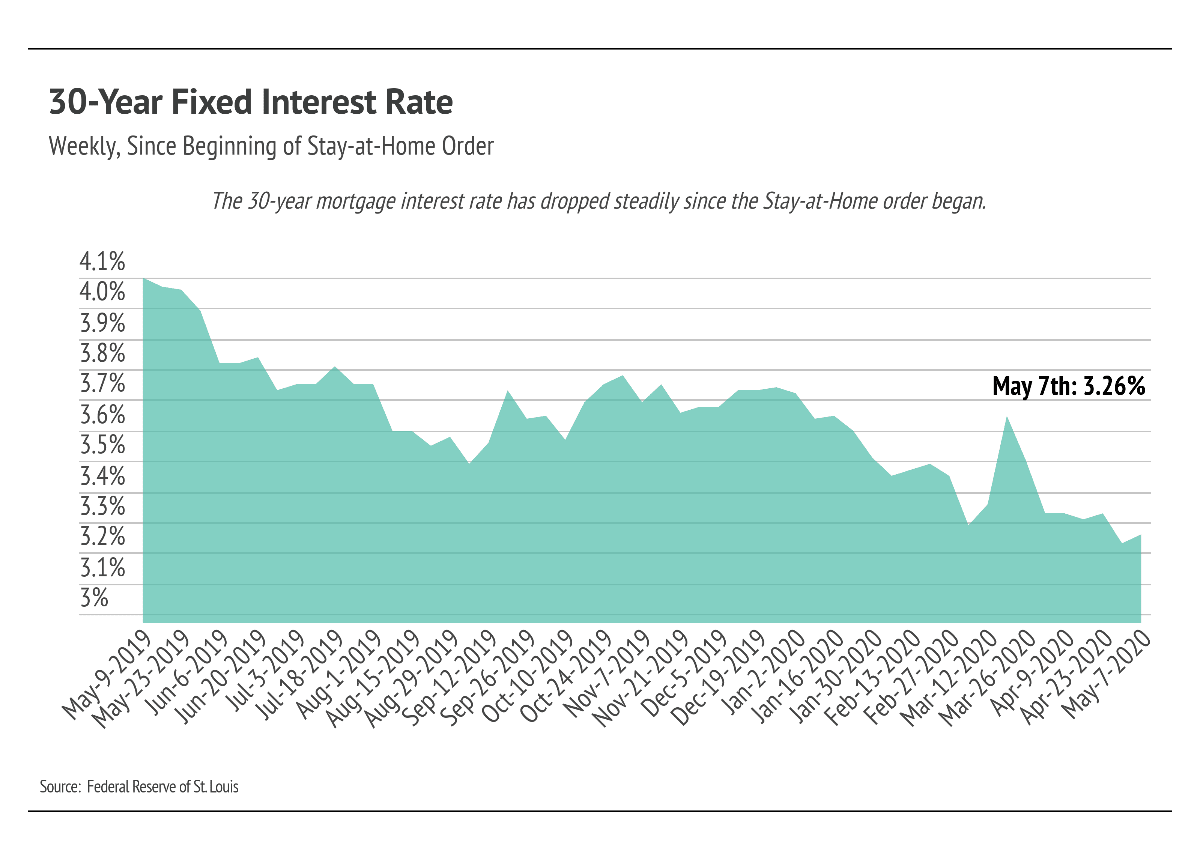 As a general rule of thumb, homeowners benefit from refinancing if they can lower their rates by at least 1%. Refinancing also provides an opportunity to dispense with private mortgage insurance (PMI), as long as the value of the home has risen and the owner has enough equity in the home.
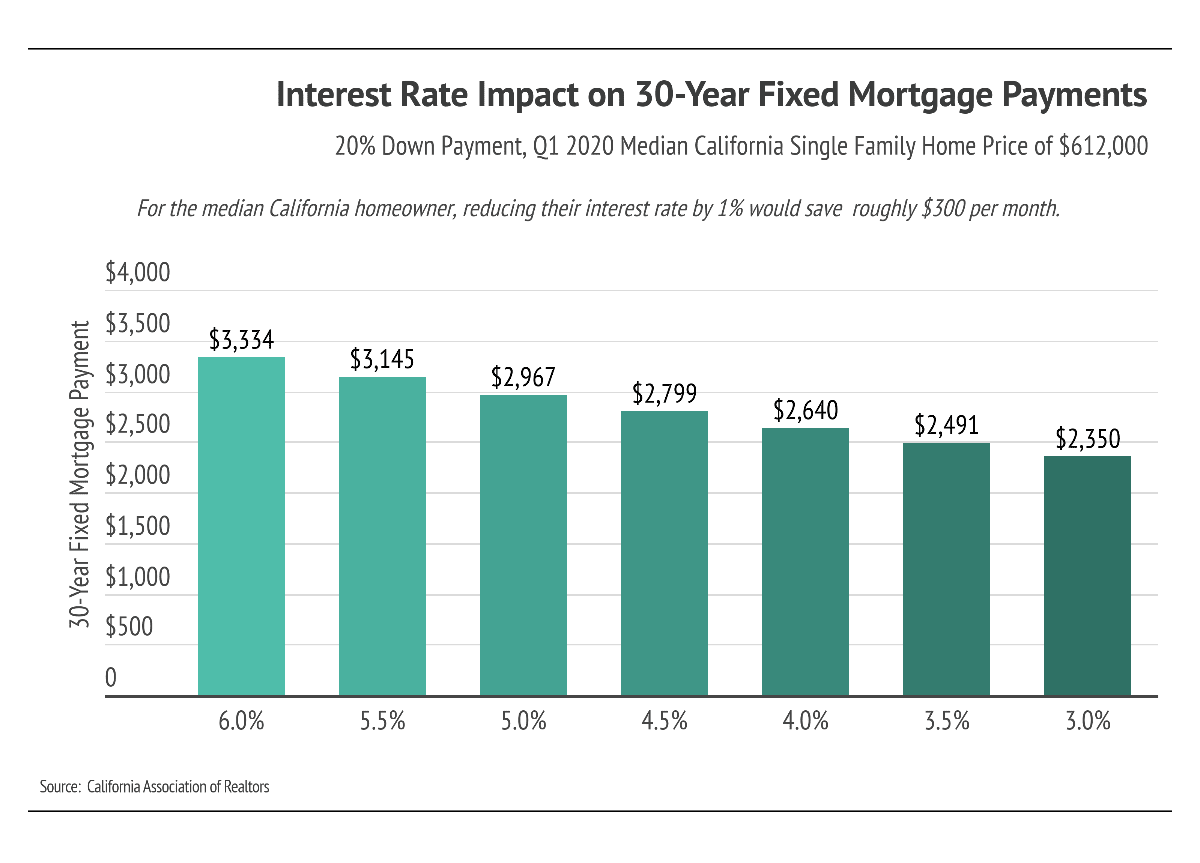 For owners of Q1 2020 median-priced California homes ($612,000), a 1% reduction would reduce monthly payments by $300. The savings for a median-priced home in San Francisco ($1.7 million) is around $800 per month. Refinancing, however, comes with costs, which include title insurance, attorney’s fees, the price of an appraisal, taxes, and transfer fees, among others. Expect refinancing to run anywhere between $1,500 and $5,000. While most costs are fixed, appraisals are variable and cost more for larger homes.
 Another sign that the housing market may be beginning to turn around is the number of listings under contract. During the week of March 30th, listings under contract hit a low with only 11 single-family homes under contract. Since then, listings under contract are almost three times that amount (31), indicating that people are forging ahead, aided by technology.
 As discussed earlier, San Francisco’s median prices rose in April for both single-family homes and condos. Although the pandemic and stay-at-home orders dampened buyer demand, the number of active listings also decreased, which buoyed prices.
 Along with a rise in median home prices, the percentage of homes that sold with price cuts remained at the lowest level in the past ten months. Only 7% of sellers had to reduce their prices in April. Rising price data will only encourage sellers to keep their listings priced where they are and wait for more buyers to come back into the market.
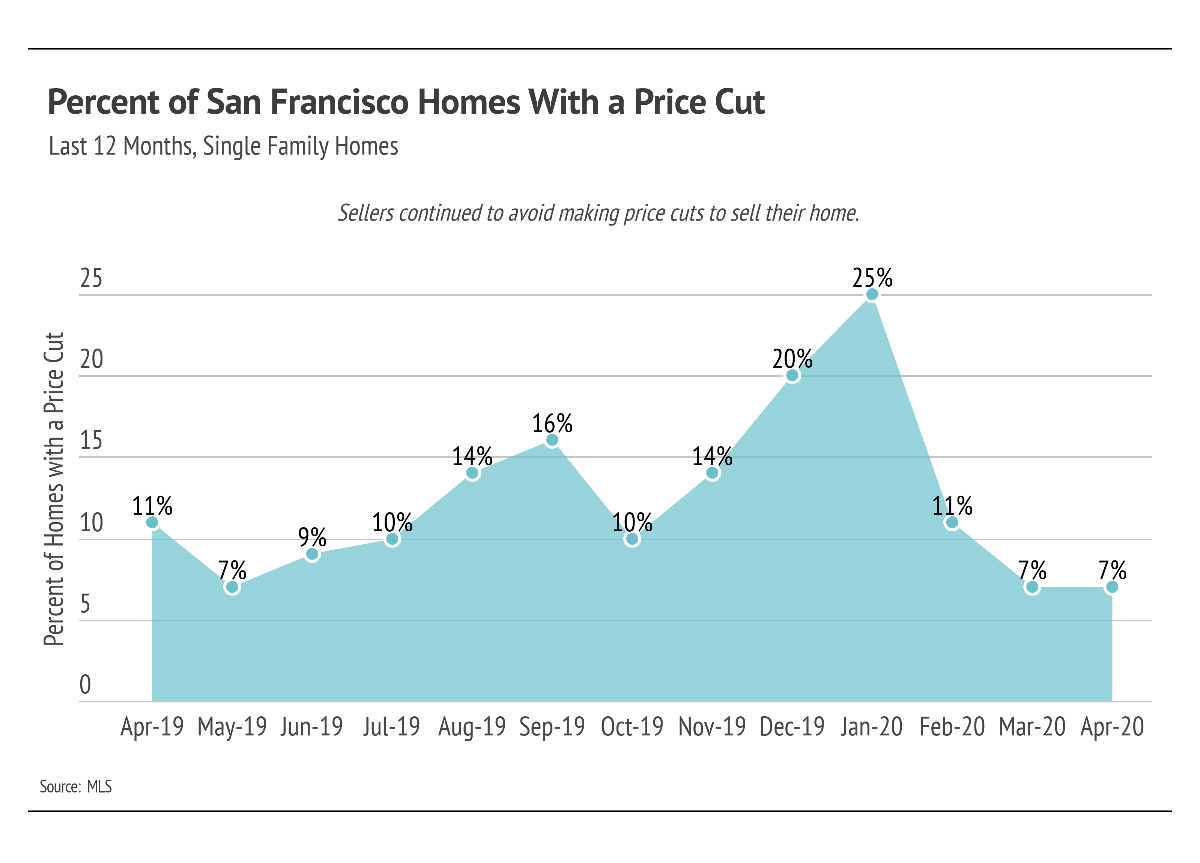 The sale-to-list ratio reflects the change in the original list price of a home and the final sale price. For example, a ratio of 100% means that a home sold for the price at which it was most recently listed. In San Francisco, single-family homes almost always have higher sale-to-list ratios than condos. In April however, single-family home sellers accepted offers at a discount for the first time in over a year. This indicates that sellers are finally making price concessions, albeit small ones, and that buyers have a bit more negotiating power. Meanwhile, sale-to-list ratios rose for condos; buyers paid a 4% premium. It’s important to note that the sample size for April sales is over 50% smaller than usual, making this month’s metrics outliers rather than the start of a new trend. We will, of course, continue to track this metric in order to guide your decision making.
 Months supply of inventory measures how many months it would take for all current listings on the market (including listings under contract) to sell at the current rate of sales. In April, the supply of single-family homes decreased but not nearly as much as the sales volume, which caused the large year-over-year jump in months supply of inventory. Months supply was 2.5 and 4.4 for single-family homes and condos, respectively, in April.
 Inventory and volume of homes sold saw a significant decrease in March and April. The year-over-year changes are particularly pronounced as sales and inventory typically have a seasonal increase in March and April, coming out of the slower Winter season.
 Looking to June, we anticipate more growth. We expect buyer demand to pick back up as fears of a steep price decline lessen. Look for more agents to leverage the latest technology to give buyers the ability to tour homes in compliance with state and local laws.
Stay up to date on the latest real estate trends.

December 2, 2021
Income is one of the largest predictors of home price growth, second only to available supply. Consumers have more money to spend, which in turn drives up prices. But … Read more

September 3, 2020
Welcome to our September newsletter. This month, we take a look at the conditions of the U.S. and global economies in relation to the local, state, and national real e… Read more

July 2, 2020
Our team is committed to continuing to serve all your real estate needs while incorporating safety protocol to protect all of our loved ones. In addition, as your loca… Read more
June 2, 2020
We hope this message finds you healthy. Our team is committed to continuing to serve all your real estate needs while incorporating safety protocol to protect all of o… Read more

August 27, 2019
Citing a desire to provide our area with a real estate business that values building meaningful relationships over dollars and cents, we are pleased to announce that a… Read more
You’ve got questions and we can’t wait to answer them.